
April 8, 2021 • Knowledge, Business
April 19, 2021 • Knowledge

Table of Contents
The development of technology to improve the quality of the website is increasingly diverse. One of them is the tool for monitoring the performance of a website. The performance of a website needs to be monitored to allow owners to make decisions for their business strategy.
The most used tool for analyzing website performance is Google Analytics. Google Analytics provides complete data about the website performance such as traffic, visitor demographics, visitor behavior, and so on.
The question is how do you use Google Analytics correctly? What should I know about Google Analytics? In this article, we will discuss it in-depth and of course, answer your questions about Google Analytics.
Google Analytics is a tool for monitoring the performance of a website. This tool was created and developed by the tech industry giant, Google. Google Analytics can be used to monitor websites or applications accurately.
The way Google Analytics works is by providing you with reports on the data of a website which includes: real-time data, visitor demographics, visitor behavior, traffic, traffic sources, and website speed. You can use this data as material for evaluating content and websites.
Evaluation of content or website needs to be done regularly. This is intended as a way for making decisions which is needed as part of a business strategy to achieve the desired goals.
As previously discussed, the function of Google Analytics is to evaluate the content and the data provided. For that, you need to install the Google Analytics tool on your website.
Following are the uses of Google Analytics as a consideration for you to install this tool:
As one of the giants in the technology industry, Google has released several versions of Google Analytics. Each version that is launched brings changes and quality improvements from its predecessor version. What is the history of the launch of Google Analytics?
The first version of Google Analytics was launched on November 14, 2005, under the name Urchin. The next version launched is Classic Analytics, also known as Classic Analytics. Subsequently, version 3, or what is known as Universal Analytics was released.
To date, the latest version of Google Analytics, namely Google Analytics 4 has been launched. This version was officially released in October 2020. Google Analytics 4 brings major changes and quality improvements over its predecessor, Universal Analytics.
Google Analytics which was released in October last year brought a big change compared to Universal Analytics. This major change includes how data on the website is reported. Indeed, Universal Analytics is still available and can be used by users.
However, with technological developments, it never hurts to start switching to use Google Analytics 4. Therefore, you must know what changes are in this latest version. Here are the major Google Analytics 4 changes that you should be aware of.
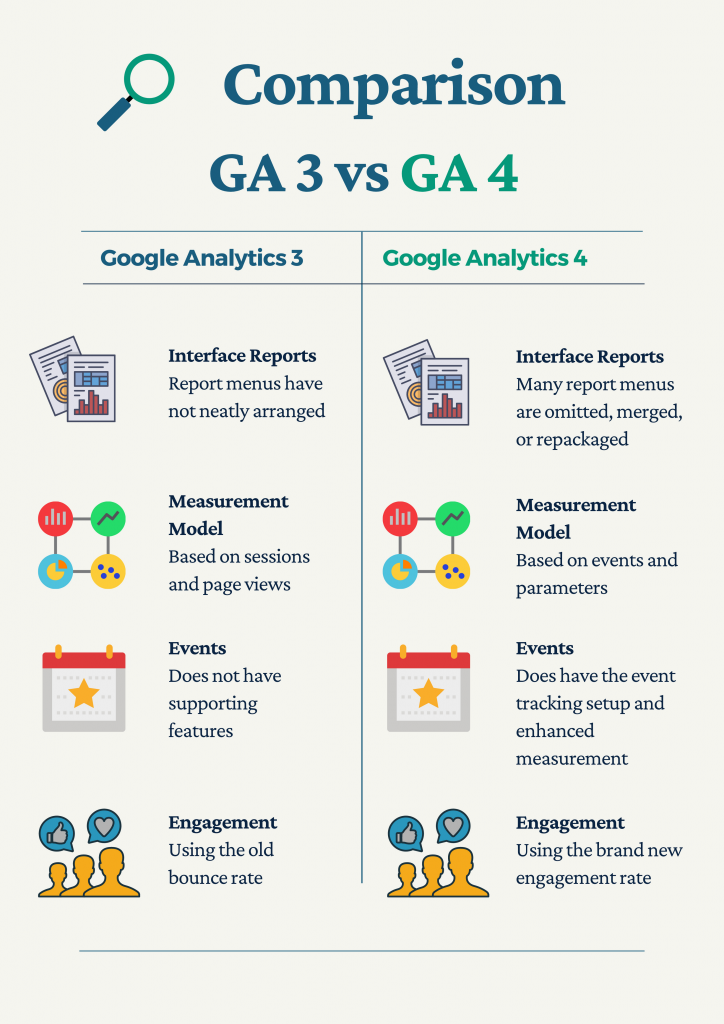
One of the biggest changes that have occurred in Google Analytics 4 is the display of the reports menu. You can see the reports menu on the left side of the screen as a sidebar. Many report menus are omitted, merged, or restructured.
At first glance, this can be confusing for some old users. However, the reports on Google Analytics have been adjusted according to how the data is obtained and then processed and displayed to users.
The measurement model is also one part that is changing. Universal Analytics still uses a measurement model based on sessions and page views whereas Google Analytics 4 measurement model is based on events and parameters.
What does it mean? Basically every activity carried out by a visitor will be analyzed by Google Analytics 4 as an event. This event will provide you with a more relevant and detailed information.
When you set up Google Analytics 4 for the first time, some fixed settings will automatically be tracked as events, including:
Each event above has its parameters which can calculate metrics for each event. Furthermore, there are 3 important points from the event that you must know.
After being a measurement parameter in Google Analytics for years, Bounce Rate is finally replaced by Engagement Rate in Google Analytics 4. This change will probably force us to adapt to the new Engagement Rate feature.
You may be wondering what is the difference between these two? The engagement Rate is an enhanced version of the Bounce Rate. Engagement Rate is reported via a new set of metrics such as engagement sessions, engagement rates, engagement sessions per user, and engagement time. These metrics can track visitor engagement on your website or app more accurately than Google Analytics 3.
Google Analytics is a tool that is most widely used by users to analyze the performance of a website has many features and characteristics. Before starting to use it, it’s a good idea to know the following 5 things about Google Analytics.

Google Analytics provides complete and in-depth information based on the data that has been obtained and then processed. This information can be used for many purposes. Among them are:
One of the things, why Google Analytics is widely used by users, is how easy it is to install. The process from registering to installing Google Analytics to the website is very easy for users.
You do not need to upload your website to Google-owned servers or update the DNS records. All you have to do is register, get a line of code and enter it on your website and Google Analytics will start collecting data.
Google has two versions of Google Analytics available. The first one is the free version. This free version already has quite complete features in its class. The free version of Google Analytics is suitable for use by personal users and SMBs.
The second one is the paid version. This version provides the data required by your website more accurately. The paid version of Google Analytics costs $ 150,000 per year. This paid version is suitable for use by corporations and large companies.
The main strength of Google Analytics is the dashboard which can be customized by users for specific goals. You can use this dashboard to focus on the data that you want to know. The Google Analytics dashboard has many widgets that can be personalized by users.
For example, widgets to view visits, time to access, visitor locations, and so on. This dashboard can be used to analyze engagements originating from social media and E-Commerce.
Google Analytics is designed for everyone. It does not matter if you are a novice or expert user using this tool. Google Analytics is designed to make it easier for users to monitor traffic data.
Some of the features that make it easy for users include:
Once you have registered and installed Google Analytics on your website, we will guide you on how to use Google Analytics. There are so many features available but we will explain only the most used features.
These features are sufficient as a basis for monitoring website performance in general. For those of you who are beginners, these basic features are very useful to understand before learning more about other features.
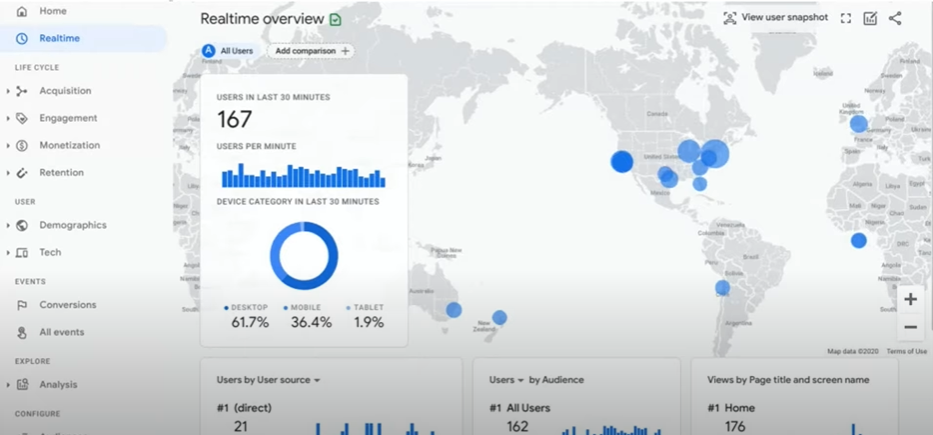
The first menu and is located at the top after the Home menu is Realtime. This menu is useful for monitoring user activity in real-time. In the Realtime menu, there is a map to find out where website visitors come from.
Users can be divided according to several time scales, such as:
In addition, there are still several user categories, such as:

The Acquisition menu is useful for knowing where visitors find your website. This feature is useful for tracking the success of any ongoing campaign or website optimization efforts. There are 3 sub-menus on this menu, namely: Overview, User acquisition, and Traffic acquisition.

Through engagement, you can find out how users interact with your website and how long it takes users to open your website. There are 3 sub-menus, namely: Overview, Events, and Pages and screens.
There are several categories for events and views such as:

Retention provides information on the number of visitors in a certain period. For example, the last 1 day, the last week, the last 2 weeks, the last 4 weeks, and so on. Retention reports are very useful to tell you about the advantages and disadvantages of website content.
There are several charts on the Retention menu, such as:

Demographics is useful for providing you the information about demographic conditions of the user such as the age, city of residence, country of origin, and so on. On the Demographics menu, there are 2 sub-menus, namely: Overview and Demographic details.

On the Tech menu, you can find out the user characteristics based on the device used. For example, platforms, operating systems, screen resolutions, and so on. In this menu, there are 2 sub-menus, namely: Overview and Tech details.

On the Behavior menu, you can find out the behavior of users visiting your website. By knowing the user behavior, you can easily provide contents that your visitors need. In this menu, there are lots of sub-menus, such as: Overview, Behavior Flow, Site Content, Site Speed, Site Search, Events, Publisher, and Experiments.
What we will focus on in this menu is the Site Content sub-menu that is considered the most important section by users.
The Site Content sub-menu is further divided into 4 sub-sections, namely:
The development of technology makes it easier for us to get information. This information can help us grow our business. Google Analytics is a tool that can provide you with important information about your website.
This information is useful as an evaluation material for further use as decision support in business strategy. Therefore, we need to take full advantage of the features available in Google Analytics. Hopefully, this article can be your guide in understanding Google Analytics to develop the quality of the website according to your expectations.
some other blog posts you might be interested in

